Dynamic Web Charts: Chart Tab
The Chart tab allows you to specify the general settings for the chart, including the type of chart, style and design.
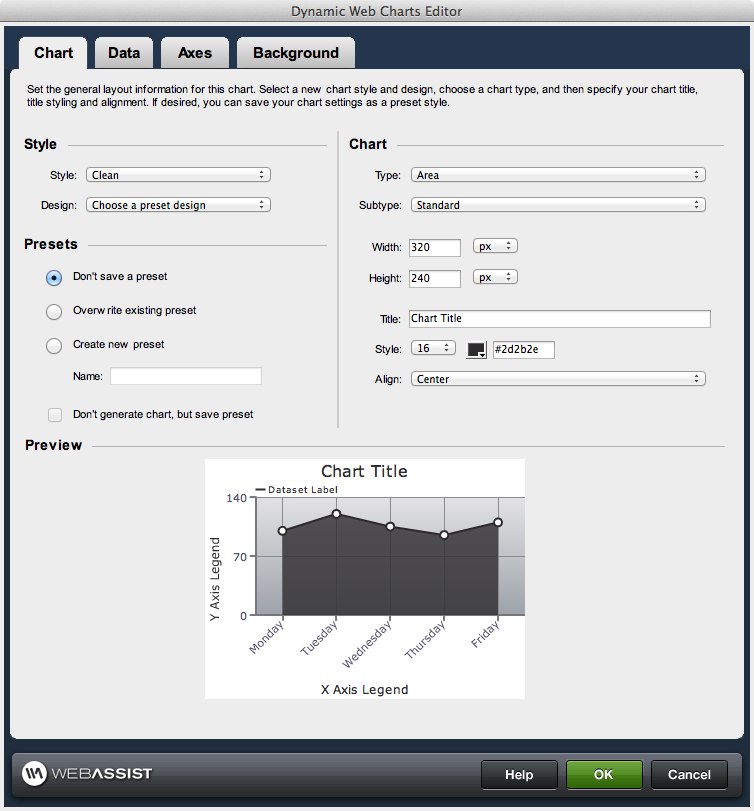
Style
- Style: Select from a number of preset styles, or a custom style that you have created or imported.
- Design: Select from a number of preset designs. When selecting a custom design, this option is not available.
Chart
The Chart section allows you to configure the type of chart you intend to use. Options in this section vary based on your selection in the Type menu.- Type: Choose the type of chart you wish to create. Chart type options are Area, Line, Bar, and Pie.
- Subtype: Provides various preset options for the appearance of the data area in your chart.
Options vary depending on chart type, and include:- Area - Standard
- Line - Standard, Dot, and Hollow
- Pie - Standard
- Bar - Standard, Outline, Glass, Sketch, 3D, and Fade
- Width: Specify the total width of your chart. Use the menu list to specify pixels or percent.
- Height: Specify the total height of your chart. Use the menu list to specify pixels or percent.
- Title: Enter a title for your chart.
- Style: Allows you to specify the styling for your chart title. Choose from the menu list to specify type size. Use the color picker to select a color for your chart title text.
- Align: Choose the alignment for your chart title. Options are, left, center, and right.